

Debugging is an underrated art. Once you start programming, you realize 90% of your time is being spent on debugging and just 10% on thinking and writing code. I'm here to share some really cool tricks for debugging in Node.js, which can save a lot of your time.
You must be thinking, what is better than "console log". But let me tell from my experience that console log is one of the worst ways of debugging, at least in Node.js. The reason behind this is, in Node.js, you will mostly deal with a complex structure of code. Even if async-awaits are used, the error handling makes it complex anyways. And in such a scenario, you might want to put console logs everywhere with different messages. Now you can imagine, how much of your time this approach is going to eat.
Q. So, what is the better approach, Rahul? 🧐
A. Using a Debugger. 😎
Being a developer, you must have come across something called a Debugger (mostly in chrome dev tools). If not...
Debugger
A debugger is a program to test and debug other computer programs. You can do it by placing breakpoints in the program, run the program and you will see it stoped at that line. Now, you can check the values of the variables, objects & function definition at that point.
Enough of theory, now let's jump into the code and let's see how can we use this cool tool.
Let's jump to the code...
Lets assume this is your JavaScript code:
const express = require("express");
let app = express();

let name = "Rahul";
console.log(name);

name += " Chouhan";
console.log(name);

app.listen(4000, (error) => {
    if (!error)
        console.log("Server running on 4000!");
});
Set up your Node.js Debugger:
- Run this script with the command
node inspect server.js. - Notice we have used the
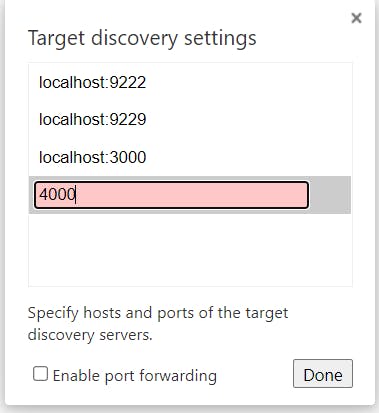
inspectflag after thenodecommand. Because of this, the Node.js process listens for a debugging client. - Open the 'chrome://inspect' link in Chrome Browser and click on the 'Configure' button.
- It will ask you for a port at which chrome can listen to the Node.js process. Enter the port at which you're running the server and click the button 'Done'.
- Now, open Chrome Dev Tools by clicking 'Ctrl+Shift+i'.
- At the top-left corner, you will see a green color Node.js icon. Click that. It will open another Chrome Dev Tool targeting your Node.js script.
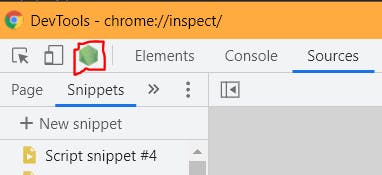
- Go to the 'Sources' tab. Search & Open your file by shortcut 'Ctrl+p'.
Fun Part: Placing Breakpoints

We are done with the setup. Now, just place the breakpoints as shown. And re-run the command node inspect server.js.
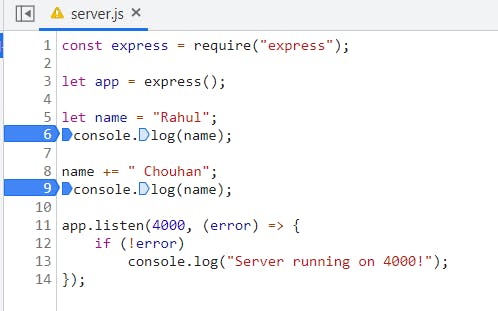
As soon as you will run the script, you will see the control paused at the 1st breakpoint we placed (at line no. 6). Hover on variable name and check value, it will show "Rahul".
Now, resume the execution by either clicking the blue color button or use short-cut 'Ctrl+\'.
It will pause again at the 2nd breakpoint (at line no. 9) after adding some text in the variable. Hover over and now it will showing you the updated value "Rahul Chouhan".
This was a very simple use-case of the debugger. Yes, I know, we don't really need any debugger for this. So now, I will replicate this in a complicated and real-time use case.
Ready for the Roller-Coaster Ride!!? 🚀
While writing this example, I have kept 2 things in mind:
Deliver simplicity in complexity.
Unreadable codebase in many companies with even worse maintenance.
In this example, I will simulate two DB calls synchronously (one by one). I'm using a very good NPM module called async (Check the references at the bottom to install). async provides straightforward, readable & easy to debug functions to work with asynchronous JavaScript.
I will be using a method waterfall() from the async module. So, let me give you a short description (full description link can be found in references) of how it works.
Async NPM Module (Short Description)
Assume, we want to run two asynchronous queries one-by-one (any code below asynchronous code doesn't wait for it to end). To achieve this,
- we will wrap them in separate functions,
- store them in an array in order &
- pass the array as the first argument in the
waterfallmethod.
Let me show you how...
async.waterfall([
    (callback) => {
        // Execute Query 1
        callback(null, query1_result);
    },

    (query1_result, callback) => {
        // Execute Query 2
        callback(null, query2_result);
    }
],
(error, query2_result) => {
    // Handle error & response
});
As you can clearly see, the method takes 2 arguments: array of functions & callback.
The order of execution is 'Query 1 -> Query 2 -> callback function'
I hope, you must have got a small idea. So, let's get back to our example.
Back to our Example
As I said, there are two DB calls.
- In the first call, I want to get specific user details.
- And in second, I want all the movies watched by this user.
async.waterfall([

    // Get user details
    (callback) => {
        User.findById(userId).exec((error, userObj) => {
            if(error) {
                let errorObj = {
                    message: "Error while get a user details.",
                    error: error
                };
                callback(errorObj, null);
            }
            else if(!userObj) {
                let errorObj = {
                    message: "No user found."
                };
                callback(errorObj, null);
            }
            else {
                callback(null, userObj);
            }
        });
    },

    // Get all the movies watched by above user
    (userObj, callback) => {
        Movie.find({ user_id: userObj._id }).exec((error, moviesArr) => {
            if(error) {
                let errorObj = {
                    message: "Error while get a movies detail.",
                    error: error
                };
                callback(errorObj, null);
            }
            else if(moviesArr && moviesArr[0]) {
                let errorObj = {
                    message: "No movies found for this user."
                };
                callback(errorObj, null);
            }
            else {
                callback(null, moviesArr);
            }
        });
    }
], (error, moviesArr) => {
    if(error)
        console.log(error);
    else
        console.log(moviesArr);
});
Assume, a previous developer had not handled/logged the errors as good as above and the code does not give the desired results, how will you know what is going wrong and exactly which part of the script is getting executed?
console log is obviously not an answer here (Work smart & hard and not just hard).
So, we will place breakpoints at several places. Now, watch this carefully as...
Few Ideas to place breakpoints
Follow these approaches as per your use-case or what is that you want to know about your code:
- To know the flow of code, place breakpoints at the start of each waterfall function.
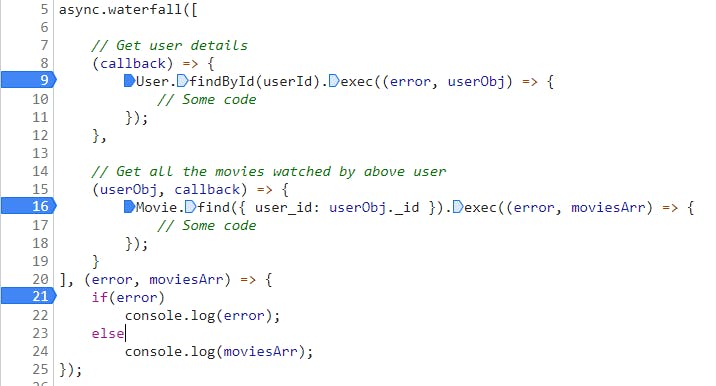
- If you want to know, how your queries are responding, place breakpoints at the first line of response callback/promise. Now, you will know, if the query has returned an error/response/empty response. (No need for copy-pasting console logs everywhere).
 Notice, breakpoints are placed just after
 User & Movie query executions.
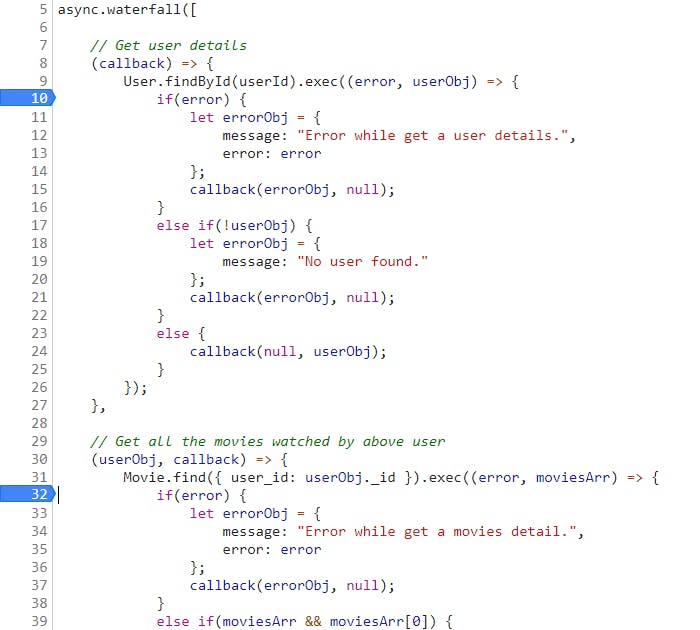
- While dealing with error responses, place breakpoints before and after all
if,else if, andelsecases. It will tell you, which block of code is causing the problem.
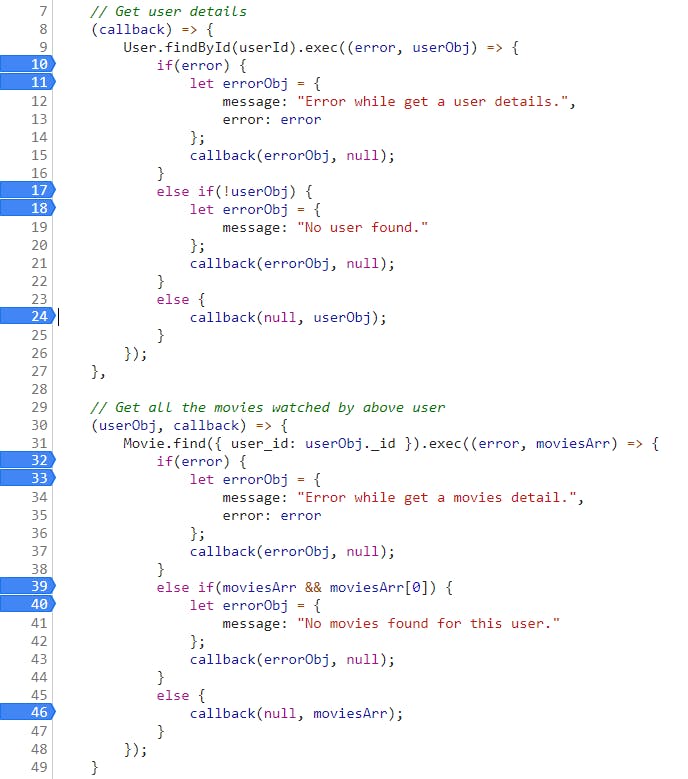 Notice, breakpoints are added before and after if-else cases
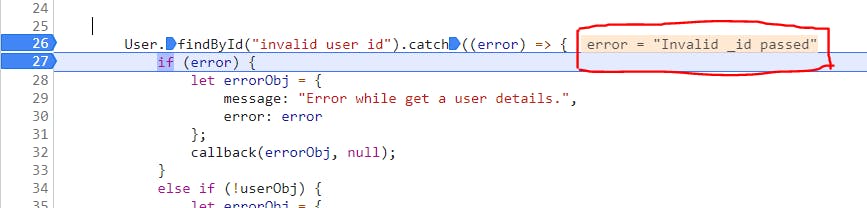
- The most difficult part is when a third-party module gets broken. In this case, logs will not even show the line number in your code as the error is somewhere in
node_modules. But, the good thing is we have left console logs far behind. So, simply wrap each query with breakpoints. By wrapping I mean, place at start and end of the execution of each query. Check every place and within a minute or less, you will know the culprit. The only problem is, the errors generating, in this case, are notstringtype. So, it might not appear on hover. You can do two things here
Error gets printed on the same line, so you can simply read from there.
You can convert error to
stringlike thiserror.toString()
- The errors easiest to debug are these :
field of undefinedorfield of null.
These errors come, when you try to use a field of an object which has not yet been defined or initialized. The best part is, logs always tell you the line number where the error is caused. So, you can simply place the breakpoint at the specific position as mentioned in the logs.
Conclusion
You must have felt that how well we can make use of a tool to solve some of the most complicated problems in a simplistic manner. For simple cases, you can simply use console.log as killing a fly with a sword is not a good idea. Make sure you are well aware of these awesome tools to take you out of a difficult situation.
That's it! 😊
Finally, we are done with this. Hope you made it till here and found it useful. Debugging is such an art that we can explore in our entire life and find useful tips & tricks daily. That being said, I am open to your comments. If you have any feedback, better ways to do this, any confusion with something, or anything else, please respond to me via comments or social media.
Twitter Profile: twitter.com/RahulChouhan97
LinkedIn Profile: linkedin.com/in/rahul-chouhan-730155169
Thank you. ❤️
References:
Debugger Wikipedia - en.wikipedia.org/wiki/Debugger
Node.js Inspector - nodejs.org/en/docs/guides/debugging-getting..
NPM async - npmjs.com/package/async
async waterfall - caolan.github.io/async/v3/docs.html#waterfall